Today in Pre-Calc we did the skate-board project. This involved watching a video that had ramp at different heights. We then had to make a predictions to see how close we were to the actual graph. After that we watched the video in slow mo to get the real points. We later compared the graphs to see how close we were.
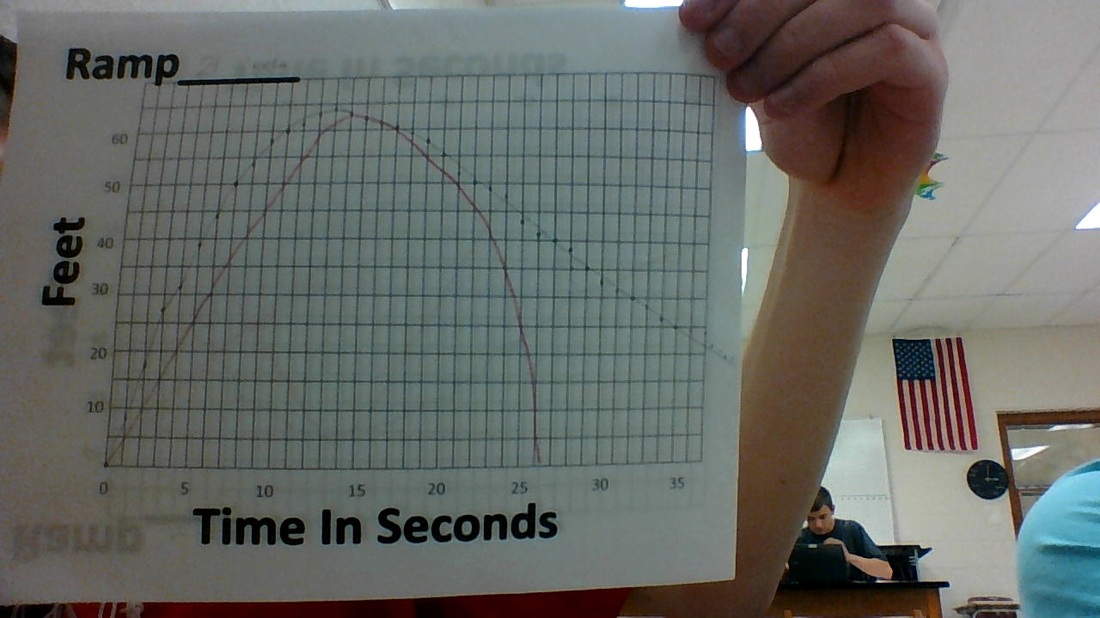
This was the 21 inch ramp graph. The colored line was my prediction line and the black line is the real graph. As you can see I was way off with the prediction. The initial starting point was 0 because it was not moving at anytime. My graph was off because I was guessing how fast it was going. The maximum of the graph was usually right but sometimes I didn't catch it. When the skate-board started rolling backwards I would end the graph to soon. The domain for this would be [0,37] and the range is [0,64].
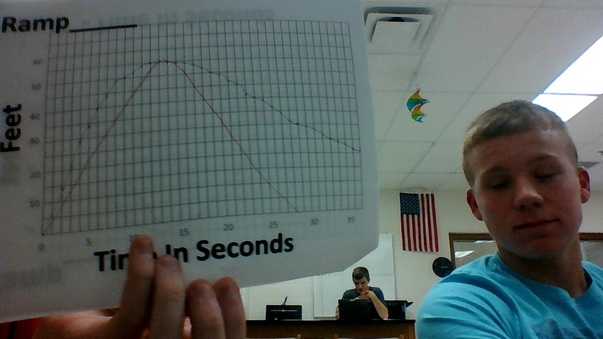
The 14 should have been easier but I still messed up. I was too slow on the acceleration but had the maximum spot on. I was also to fast on the acceleration which ened to early. It was hard for me to gauge the exact points at which it crossed the points. When it was replayed in slowmo it was alot easier. The domain is [0,37] and the range [0.55].
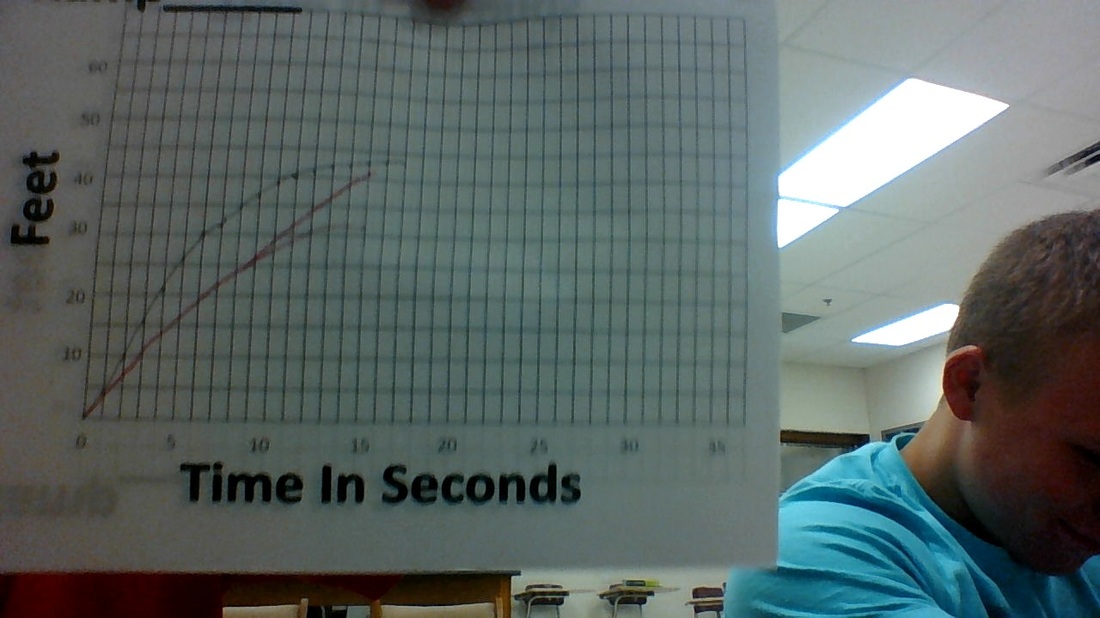
The 7 inch ramp threw me for a loop. I didn't expect for it too end so early. I wasn't fast enough on the acceleration and didn't hit the height in the right spot. I didn't expect it to end so early either. The domain is [0.11] and the range is [0.44]
