Rose Graph
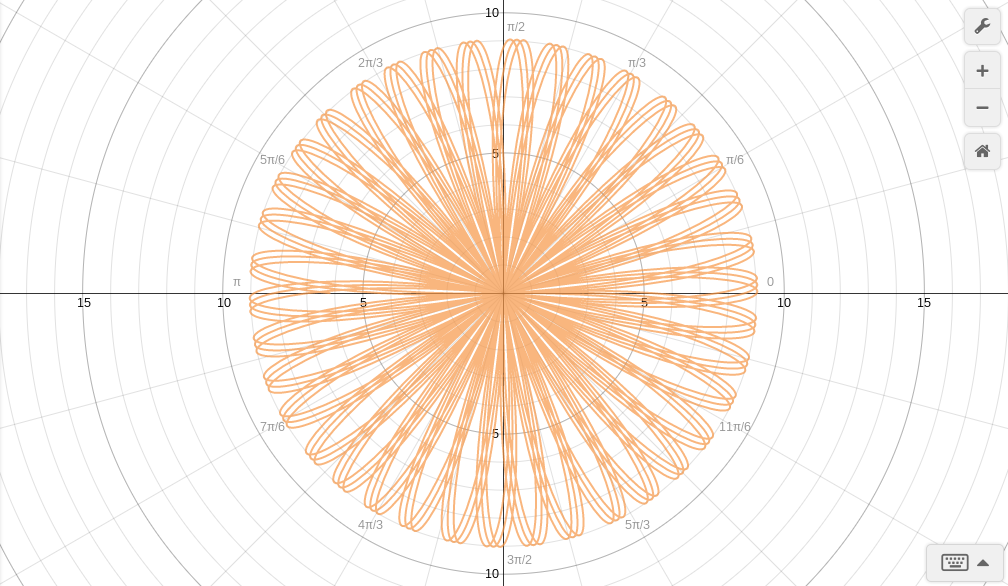
This graph I used the equation r=acosbtheta to begin with. I turned the a and b coefficient to sliders. Desmos allows you to auto play the sliders. I stopped the sliders at what I thought was the coolest "rose".
My MasterPiece!
http://goo.gl/Gf1XTf
above is a link to the video I made of my masterpiece. I started with the r=theta. I then added coefficients to make it r=athetab. A and B where slides and I turned them on to auto play. The result was a spinning spiral.
above is a link to the video I made of my masterpiece. I started with the r=theta. I then added coefficients to make it r=athetab. A and B where slides and I turned them on to auto play. The result was a spinning spiral.
